Bootstrap Percolation
(Scroll down for information about the picture...)

What is this?
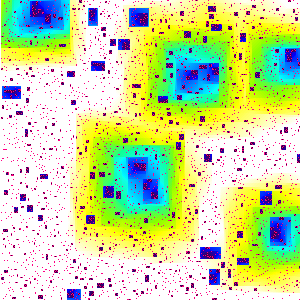
We start with a square array of 300 by 300
smaller squares, called "sites". Initially, 5% of the sites are
chosen at random to be "infected" - these sites are coloured red.
The picture then evolves in discrete time steps according to the
following rules. Infected sites remain infected for ever. A
currently uninfected site becomes infected at the next time step if at
least two of its four nearest neighbours are currently infected. In
the particular experiment above, the entire square eventually became
infected. The picture shows the time at which sites became infected:
initially infected sites are red, subsequent
infections are black (earliest),
followed by dark blue, light blue, green, yellow, and finally white (latest).
Mathematics
What determines whether the entire square eventually becomes infected?
Clearly it depends of the size of the square and the proportion of
sites initially infected, but how exactly? In the case of very large
squares, the following answer is proved in [6].
Consider a series of experiments in which the size of the square
becomes larger and larger indefinitely. Fix a number c, and
adjust the initial proportions of infected sites so that when the
square is L by L sites, the proportion is
c / ln(L). (Here "ln" is the natural logarithm). Then,
in the limit as the square become large, the probability that it will
become entirely infected approaches 1 (certainty) if c>&lambda, or 0
(certain not to happen) if c<&lambda, where
&lambda = &pi2 / 18 = 0.548311...
Theory versus Experiment
The model seems ideal for computer simulation.
Surprisingly however, simulation results can lead to misleading
predictions about limiting behaviour (or vice-versa, depending on one's
perspective). Simulations in [2] involving squares up to 28,800 by
28,800 (nearly a billion sites) resulted in the prediction
&lambda = 0.245 ± 0.015,
different from the rigorous value above by more than a factor of two!
The reason for the discrepancy seems to be that the convergence to the
limiting constant 0.548311... is extremely slow, so even very large
simulations do not come very close. In fact, combining the simulation
results of [2] with the rigorous results of [6], one may (tentatively) estimate that
in order to get close to the limiting value, one would need to
simulate a square of about
100,000,000,000,000,000,000 by 100,000,000,000,000,000,000
(1020 by 1020) sites,
certainly well beyond the range of any computer!
Applications
The above model is called bootstrap percolation, and serves as
a mathematically idealised model for phenomena of nucleation and
growth. Such models have been applied in the study of crack
formation, magnetic alloys, hydrogen mixtures, and computer storage arrays.
See the references below
for more information. More generally, bootstrap percolation provides
an important stepping stone towards understanding other cellular
automaton models, which have numerous applications in physics, biology
and information technology.
References
Links:
Primordial Soup Kitchen. David Griffeath's cellular automaton page
Analysis of Local Growth Models. Lecture notes by Janko Gravner
Bootstrap Percolation in Eric Weisstein's Mathworld.
Articles:
[1] J. Adler. Bootstrap percolation. Physica A, 171:453-470, 1991.
[2] J. Adler, D. Stauffer and A. Aharony. Comparison of bootstrap
percolation models. Journal of Physics A, 22:L297-L301, 1989.
[3] M. Aizenman and J. L. Lebowitz. Metastability effects in bootstrap percolation models. Journal of Physics A, 22:L297-L301, 1989.
[4] R. Cerf and F. Manzo. The threshold regime of finite volume bootstrap percolation. To appear.
[5] J. Gravner and D. Griffeath. First passage times for threshold growth dynamics on Zd. Annals of probability, 24(4):1752-1778, 1996.
[6] A. E. Holroyd. Sharp metastability threshold for two-dimensional
bootstrap percolation. Probability Theory and Related Fields,
125(2):195-224, 2003.
[7] R. H. Schonamnn. On the behaviour of some cellular automata related to bootstrap percolation. Annals of probability, 20(1):174-193, 1992.
Alexander E. Holroyd 2005

